
DevOps Metrics : 15 KPIs that Boost Results & RoI

DevOps has become the go-to standard for software development.
This is simply because of its potential in facilitating the development of high-quality software at faster rates, ensuring that customer requirements are met steadfast.
DevOps principles have also been pivotal in seamlessly fusing the functions of development and operations teams as a singular entity rather than two diverse silos.
To leverage the many advantages that it can bring to the software development process, it is important to treat DevOps as a journey and not a destination unto itself. This essentially means gathering feedback, creating benchmarks, and continually measuring results to track progress.
That’s where tracking metrics come into play. We dive into the what, why, and how of tracking metrics for the success of DevOps journey:
Benefits of Measuring DevOps
So, you have successfully transitioned to DevOps and deployed it for your software development process.
But how do you ascertain whether it is yielding the desired results?
How do you track the bottlenecks and identify the roadblocks hampering delivery speed?
How do you track customer satisfaction and identify the reasons for a subpar experience?
The answer to each of these questions is the same – by tracking metrics and analyzing performance. Thus this becomes a vital step in your Enterprise DevOps roadmap.
It is for this reason that more and more organizations are acknowledging the need to measure DevOps, ensuring that their software is equipped to deliver on a consistently enhanced customer experience. In this regard, the concept of value stream mapping – a lean measurement technique – is also being widely discussed in the tech industry.
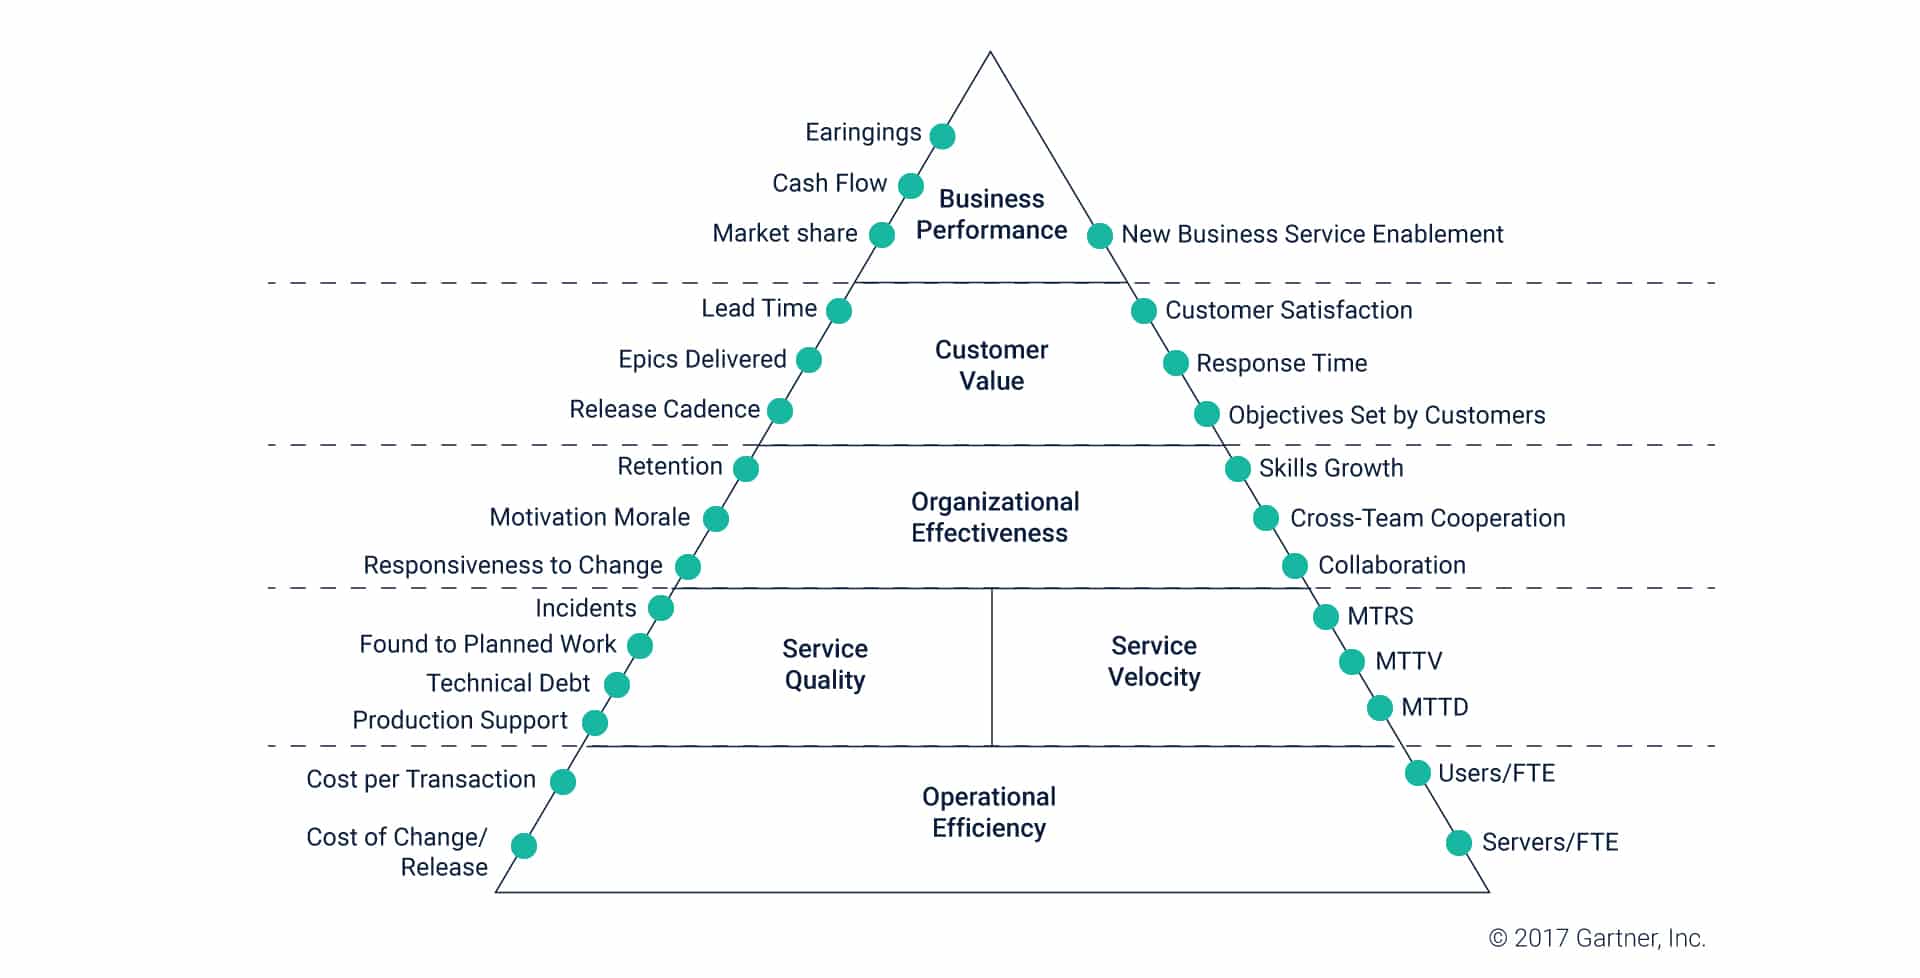
The readiness to constantly track metrics and measure performance unlocks a host of benefits for the software development lifecycle. You can collect and analyze data such as DevOps reports analytics, toolchain activities, and performance.
Managers can then compare these metrics on a set of key performance indicators (KPIs) to determine the robustness of their DevOps operations, both on a project-to-project basis as well as across the board.
Since DevOps is an ongoing process, continuous checks and rectification are essentials for its expansion within an organization. Besides, measuring DevOps gives you data-driven insights on how your IT processes are working, allowing you to make informed choices for increasing efficiency, speed, and quality.
Top 15 Metrics to Track for Measuring DevOps
It is clear that measuring metrics is critical to the success of an organization’s DevOps journey. But how do you decide which KPIs to choose? Which metrics correspond to high-performing DevOps?
Let’s take a look at the 15 key KPIs that must be factored in when assessing your DevOps success.
-
Availability and Uptime
When you’re trying to strike the perfect balance between speed and quality of your software products, your applications being down is the last thing you want. That makes availability a prime KPI for measuring DevOps success.
Availability essentially highlights the amount of downtime considered acceptable for an application. It can be measured on two yardsticks – read/write or complete and read-only or partial availability. Naturally, the aim is to optimize uptime and reduce downtime as much as possible.
Achieving 100% availability may be unrealistic, once you factor in planned downtime for maintenance as well as unforeseen outages. The endeavour should be to cultivate an architecture that is capable of bouncing back from unplanned downtime in the shortest possible time frame.
-
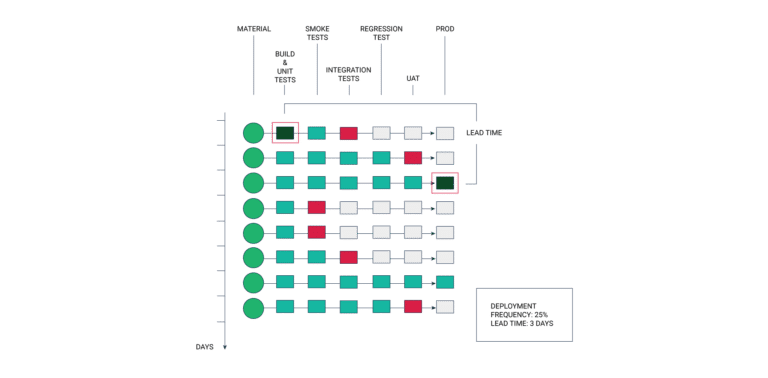
Deployment Frequency
This KPI indicates how frequently new capabilities and features are rolled out. The development frequency must be tracked and measured on weekly or daily. Organizations that are still scaling up their DevOps journey to improve efficiency prefer to track this metric every day.
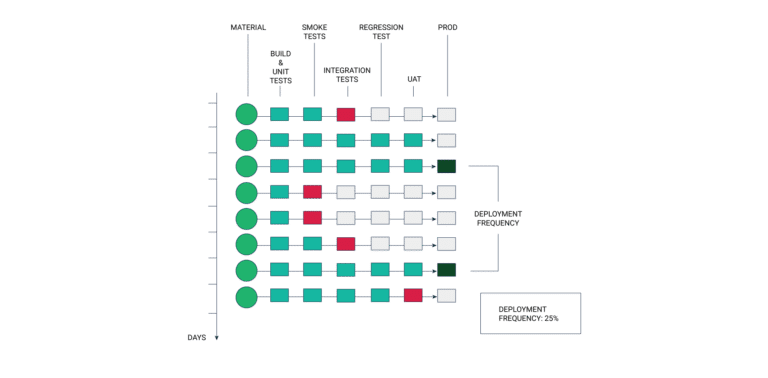 As a rule of thumb, the deployment frequency should either remain consistent or maintain a small but steady upward trajectory. Any sudden dip in deployment frequency indicates that your DevOps processes are being obstructed by bottlenecks in the workflow.
While a high frequency of deployments is considered healthy, a high failure rate or spike in deployment time is often seen as a sign of underlying issues that need to be resolved.
-
Deployment Time
Since the basic premise of DevOps services is to ensure high-quality software development at faster rates, tracking the time taken to deploy an application makes for a good metric. You must measure the time taken to roll out deployments after they’re approved. This can go a long way in identifying problems and reducing deployment time.
Faster deployments naturally increase your deployment frequency too. When measuring this metric, it is vital to pay attention to any sudden and dramatic rise in deployment time, especially if they correspond with a dip in deployment volumes.
While decreased deployment time is something to aspire to, it shouldn’t happen at the cost of accuracy. Quick deployments become meaningless if they’re accompanied by high rates of error.
-
Failed Deployment Rate
Any deployment resulting in performance issues or leading to subpar customer experience is recognized as a failed deployment. As such, tracking the percentage or rate of such deployments is a crucial metric of assessing DevOps success.
The expectation here is that your teams will be able to build high-quality products from the inception of a project, as the responsibility of maintaining the highest quality standards rests with the entire team and not just the QA department. Ideally, this should mean that there are no failed deployments at all. However, that’s not a realistic expectation.
Tracking failed deployment percentages can help you take stock of ground realities and prepare a plan to counter roadblocks. This approach pushes you closer to the magic number of 0 failed deployment rate.
As long as your failure rate is below 5%, your DevOps processes can be considered robust. A failed deployment rate of 10% or more, on the other hand, suggests a need for overhauling the processes.
-
Time to Detection
While a low failed deployment rate is an encouraging metric, it does not mean that your processes are free from problems. Issues occur in every project. What counts is how quickly you can detect and fix these issues.
Time to detection is the KPI that helps you understand whether your response time and application monitoring processes are functioning optimally. DevOps teams must strive to minimize the time between the emergence of an issue and its detection and remedy.
Once again, the closer your time to detection is to zero, the more robust your DevOps processes. This cannot be achieved without implementing the right protocols and establishing communication channels between team members.
-
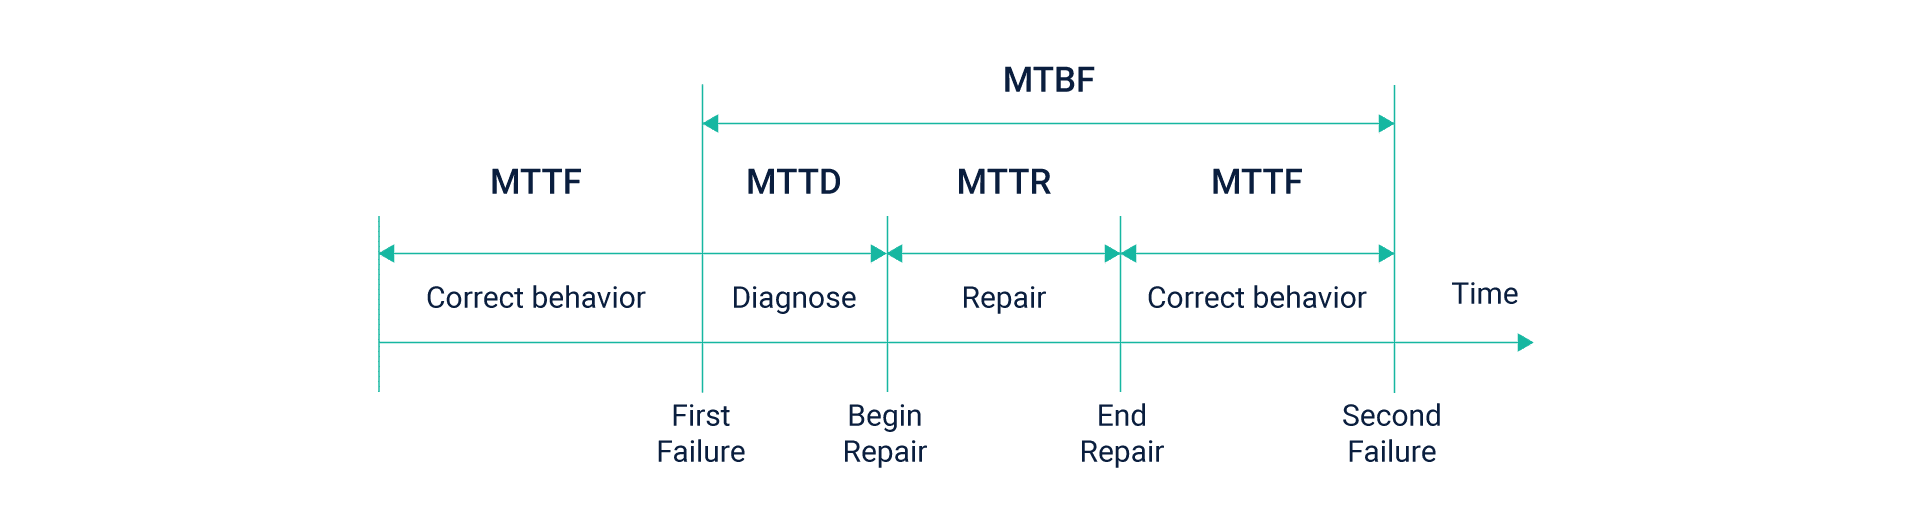
Mean Time to Recovery
The mean time to recovery is the time taken to repair a snag and restore service after an outage. This period includes the time taken to detect a failure and then taking remedial action to restore normal operations.
 This becomes a key DevOps metric as it offers unique insights into complex issues at play and a team’s ability to handle them swiftly. While sudden outages, as well as planned downtime, cannot be eliminated, designing for failure right from the beginning can help minimize to a great extent.
-
Lead Time
Lead time refers to the time taken for a committed code to go into production successfully. It is vital to measure this metric since DevOps is all about continuous software lifecycles where new codes are being developed and deployed all the time.
 Measuring the time taken to conceive a code and deploying it gives you a clear idea about your DevOps team’s ability to adapt to changing requirements and compute them as they evolve. Of course, the lesser the lead time, the better a team’s grip on the project.
-
Defect Escape Rate
The risk of a new defect in the process of software deployment cannot be ruled out. Sometimes, these defects can go undetected until the acceptance testing stage. In the worst-case scenarios, they may pass the acceptance testing only to be detected by the end-user.
The defect escape rate gives you a reality check about the number of defects detected in production, during, and after deployment. The fact that this metric exists is in itself an acknowledgment that issues are a real possibility in the software development process.
What defect escape rate does is allow you to identify the cracks through which these defects are slipping and make adjustments to make quality checks more watertight.
-
Defect Volume
The defect volume is essentially an extension of the defect escape rate that focuses on the volume of defects detected in a particular application and at what stages. While the presence of some defects or issues is to be anticipated, a high volume – or a sudden rise in volume – is a cause for concern.
If this metric is off, it indicates issues with test data management or development process. That’s why it is important to track, as it tells you exactly what areas need fixing.
-
Customer Ticket Volume
This metric is a tell-tale indicator of your application’s performance. As mentioned before, often defects, bugs, or other issues can escape the testing stage and are detected by the end-user.
When that happens, they reach out to you seeking support or for sharing feedback on the performance on an application. As such, the customer ticket volume can be the worst or best indicator of an application’s performance. A high ticket volume indicates performance and quality issues whereas low volume points to application robustness.
-
Code Committed
This metric is used to track the number codes your team commits to the software before it is ready to be deployed. This, in turn, offers you an insight into code quality and deployment velocity.
Your DevOps team defines the acceptable range for code commits on a case-on-case basis. As long as the code committed rate is within this range, there is no cause for concern. But too many commits are an indicator of poor quality or lack of clear direction in the development process.
On the other hand, a drastically low number of commits signals to a non-productive, exhausted team. Tracking this metric not only helps maintain development quality and velocity but also productivity and team satisfaction.
-
Error Rate
Just like defects and issues, errors are also an integral part of the software development process. An unusually high error rate points to inherent problems in the workflow, resulting in subpar performance. The most common errors that you can encounter are production issues and bugs. While the former is a result of query timeouts and poor database connections, the latter relates to code-related problems spotted after deployment.
If the error rate exceeds 2% – that is more than 2 errors are detected in 100 transactions – it means there is a need to analyze processes from a fresh perspective.
-
Automated Tests Pass Percentage
Since DevOps is a highly automated process, tracking the automated tests pass percentage becomes crucial for maintaining an upward trend in your deployment velocity. This means effectively using the unit and functional testing to see how often changes in code are resulting in test breakages.
-
Application Performance
Looking for performance issues, obscure errors, and other potential problems before deploying an application are good practices. But it is also equally important to track application performance during and after deployment. This is crucial for DevOps success since the performance of parameters such as web service calls, SQL queries, and other dependencies can change after application deployment.
 The application performance metric allows you to visualize and pre-empt these problems, and prevent roadblock later on.
-
Repository Speed
The repository speed refers to the review duration of pull requests for the past 30 days. An ideal repository speed score can be achieved when that average pull request time is between zero to 2 weekdays, from Monday to Friday. If this average pull request time is five weekdays or more, the repository speed score is reduced to zero.
This is because a delay can cause old pull requests to get lost, especially when you’re handling multiple repositories. Repository speed score becomes a vital metric as it helps ensure that developers are focusing their code review efforts when they matter the most.
The Bottom Line
While each of these is a vital cog in keeping the DevOps wheel moving in the right direction, concluding the success or failure based on just one KPI hardly ever provides the complete picture. When analyzed in tandem, these metrics tell a story of their own – one that tells you precisely what’s working and what needs to be overhauled.